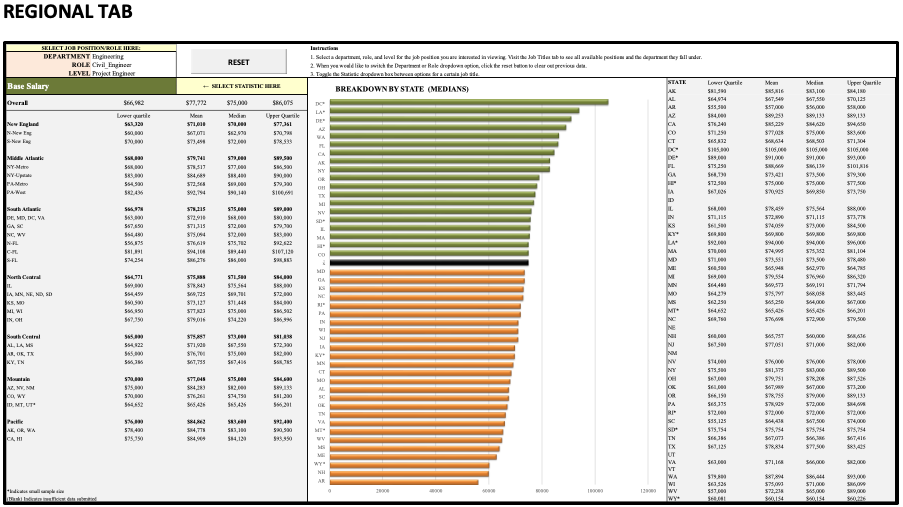
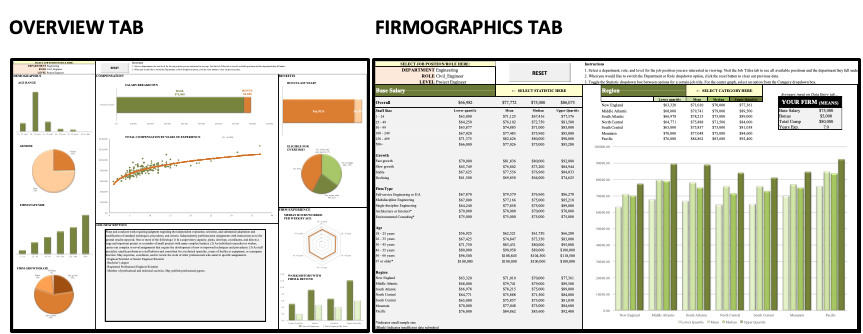
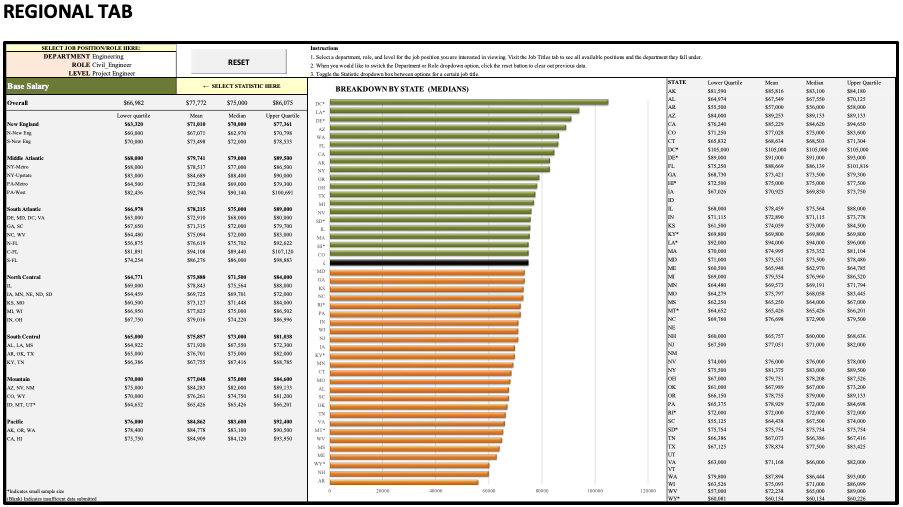
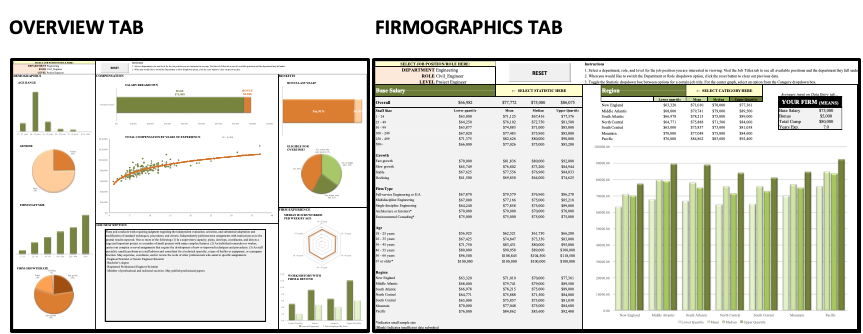
The Benchmarking Tool will help you:
- Compare your staff's compensation to those in firms just like your own
- Find out what the normal compensation range is for every type and level of position in an AEC firm
- See how salaries change as firms grow in size and help you prepare for your own firm's future
- Evaluate total compensation on a state-by-state and regional basis
- If you have offices in more than one state, see where employees are earning the most — and the least
Choose from one of these regional editions for a more specific data set:
-
East edition: Maine, New Hampshire, Vermont, Massachusetts, Rhode Island, Connecticut, New York, New Jersey, Pennsylvania, Delaware, District of Columbia, Florida, Georgia, Maryland, North Carolina, South Carolina, Virginia, and West Virginia
-
Central edition: Illinois, Indiana, Iowa, Kansas, Michigan, Minnesota, Missouri, Nebraska, North Dakota, Ohio, South Dakota, Wisconsin, Kentucky, Tennessee, Alabama, Mississippi, Arkansas, Louisiana, Oklahoma, and Texas
-
West edition: Montana, Idaho, Wyoming, Colorado, New Mexico, Arizona, Utah, Nevada, Alaska, California, Hawaii, Oregon, and Washington
Each variant includes data for a wide range of technical staff — from civil, structural, electrical, mechanical, geotechnical, environmental, and traffic/transportation engineers, to architects, landscape architects, planners, construction managers, and land surveyors. Technical staff data are broken into five levels — entry-level, project engineer, project manager, department head, and principal.
The tool also shows salaries and bonus for management positions — such as presidents, CEOs, CFOs, branch managers, and others — as well as IT, marketing, and administrative staff. Average years of experience, hours worked in a week and whether overtime is paid to a position are included for all job titles.

